Multiple Choice
Identify the
choice that best completes the statement or answers the question.
|
|
|
1.
|
Suppose  is the lower sum of the area enclosed by the graph is the lower sum of the area enclosed by the graph  the x-axis, and the lines the x-axis, and the lines  and and  by
partitioning by
partitioning  into four subintervals into four subintervals  , ,
 , , and and  . Then . Then  is is
|
|
|
2.
|
Let  be an integrable
function on be an integrable
function on  . Which of the following is not
always true? . Which of the following is not
always true?
|
|
|
3.
|
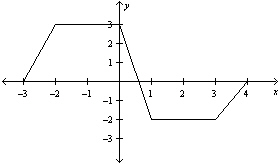 Graph of f
The graph of the piecewise-defined
function f is shown in the figure above. What is  ?
a. |  | b. |  | c. | 9.3 | d. | 1.5 |
|
|
|
4.
|
|
|
|
5.
|
|
|
|
6.
|
Which of the following limits is equal to  ?
|
|
|
7.
|
The derivative 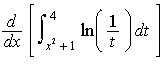 is is
|
|
|
8.
|
By part 2 of the Fundamental Theorem of Calculus
,  is is
|
|
|
9.
|
|
|
|
10.
|
The bounds m and M used in the Bounds
on an Integral Theorem for 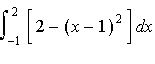 are are
|
|
|
11.
|
The average value of  on on  is is
|
|
|
12.
|
The indefinite integral 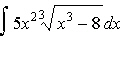 is is
|
|
|
13.
|
The indefinite integral  is is
|
|
|
14.
|
The indefinite integral  is is
|
|
|
15.
|
The indefinite integral 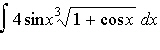 is is
|
|
|
16.
|
The indefinite integral 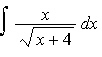 is is
|
|
|
17.
|
If  is an even function is an even function 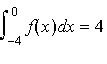 ,and ,and 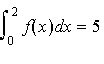 , then , then is
is
a. |  | b. |  | c. | 0 | d. | 1 |
|
|
|
18.
|
|
|
|
19.
|
What is the general solution to the differential
equation  ?
|
|
|
20.
|
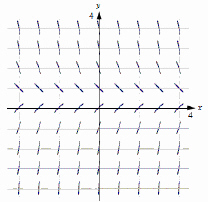 Shown above is a slope field for which of
the following differential equations?
|
Essay
|
|
|
21.
|
Time (h) | 0 | 2 | 4 | 6 | 8 | 10 | 12 | Rate (l/h) | 785 | 552 | 478 | 465 | 525 | 679 | 815 | | | | | | | | |
The
table above shows the rate (in liters per hour) at which water pours over a spillway, recorded at
two-hour intervals. (a) Estimate the total volume of water that
has drained over  by finding the left and right Riemann sums of the
data and averaging them. (b) The quadratic regression function for the data is  .
Find the indefinite integral of this function. (c) Use  to make a second
estimate of the total volume of water that has drained.
|